Reading network traffic is essential for system administrators, network engineers, and security analysts. At some point there will be a need to read the network traffic directly instead of monitoring application level details. Examples of situations that might require monitoring network traffic are, auditing network security, debugging network configurations, and analyzing usage patterns. For this task we use network monitoring software, or protocol analyzers, that sniff the traffic your computer is able to see on the network. What exactly your computer can see really depends on how the network is laid out, but the easiest way to figure out what it can see is just start sniffing.
The most common tool to do the job is readily available. One of the most popular and easy – to - use tool for monitoring network traffic is Colasoft protocol analyzer.
How to Monitor Network Traffic
As a protocol analyzer, Capsa make it easy for us to monitor and analyze network traffic in its intuitive and information-rich tab views. With Capsa's network traffic monitor feature, we can quickly identify network bottleneck and detect network abnormities. This article is to discuss how we can monitor network traffic with Capsa's network traffic monitor feature.
1,Monitor network traffic in "Summary" tab
"Summary" is a view that provides general information of the entire network or the selected node in the "Explorer". In "Summary" we can get a quick view of the total traffic, real-time traffic, broadcast traffic, multicast traffic and so on. When we switch among the node from the explorer, corresponding traffic information will be provided.
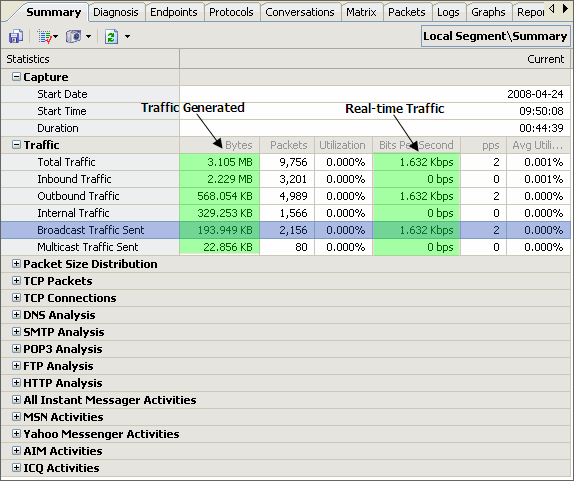
(pic 1. monitor-network-traffic-in-summary)
In "Endpoints" view, we can monitor network traffic information of each node, both local and remote. With its easy sorting feature we can easily find out which host is generating or has generated the largest traffic.

(pic 2. monitor-network-traffic-in-endpoints)
3,Monitor network traffic in "Protocols" tab"Protocols" view will list all protocols applied in network transmission. In "Protocols" view we can monitor network traffic by each protocol. By analyzing network traffic by protocol, we can understand what applications are using the network bandwidth, for example "http" protocol stands for website browsing, "pop3" stands for email, etc.
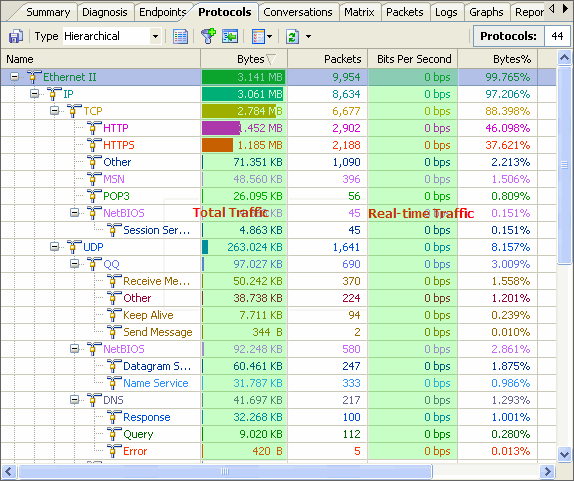
(pic 3. monitor-network-traffic-by-protocol)
4,Monitor network traffic in "Conversations" tabIn "Conversations" tab we can monitor network traffic by each conversation and the figure out which conversation has generated the largest network traffic.
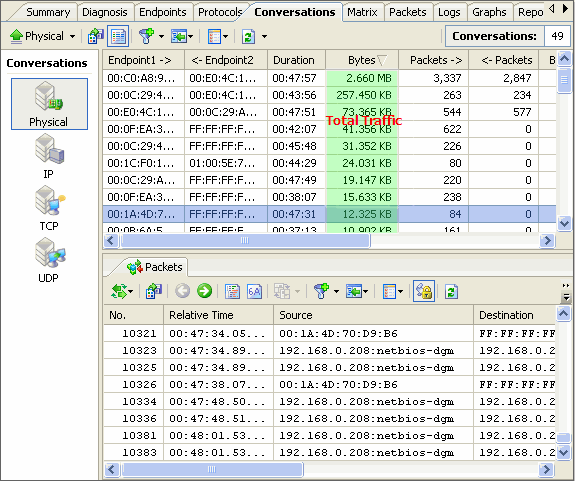
(pic 4. monitor-network-traffic-by-conversation)
5,Monitor network traffic in "Matrix" tab"Matrix" is a view that visualizes all network connections and traffic details in one single graph. The weight of the lines between the nodes indicates the traffic volume and the color indicates the status. As we move the cursor on a specific node, network traffic details of the node will be provided.
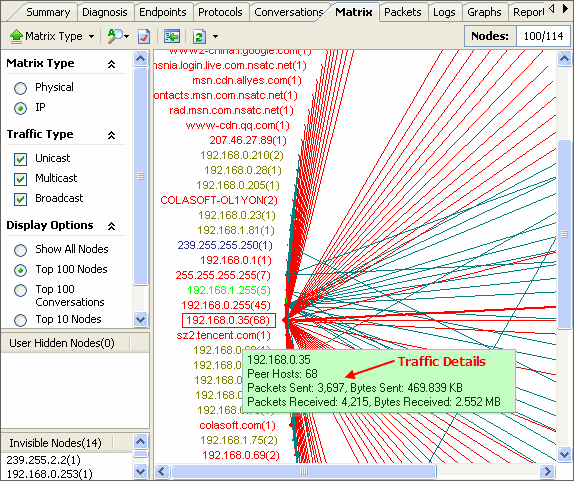
6,Monitor network traffic in "Graphs" tab
If we want to get a trend chart of the network traffic, then we need to use the "Graphs" tab. "Graphs" view allows us view network statistics dynamically in different chart types, such as ling chart, bar chart, and pie chart. By selecting "Utilization" we get a real-time traffic trend chart.
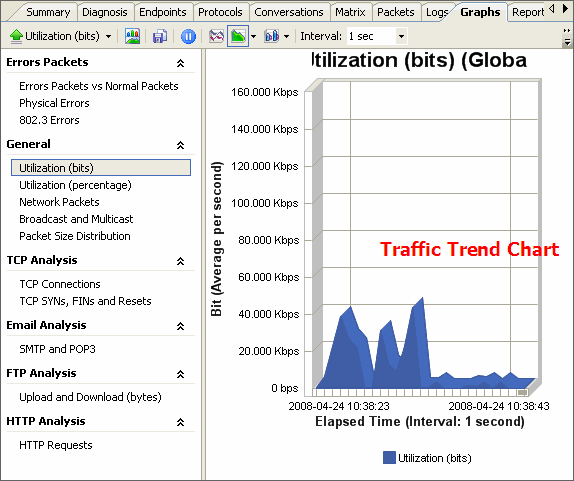
As we can see, with Capsa we can not only monitor network traffic in convenience, but also analyze network traffic in deferent levels, thus enables us quickly and efficiently detect network abnormities and troubleshoot network problems.

No comments:
Post a Comment